In this article we will learn about acceleration time graph. Graphs are crucial in physics as they visually represent, analyze, and interpret relationships between physical quantities.
The Acceleration-Time graph provides information about an object’s change in velocity, just as the Velocity-Time graph provides information about an object’s change in displacement (position). Both graphs offer insights into different aspects of an object’s motion.
Read on to learn more about a-t graph.
What is acceleration time graph?
An acceleration-time graph is also known as an a-t graph or acceleration vs. time graph.
It is is a graphical representation that shows the relationship between the acceleration of an object and the time during which it accelerates.
It is a graph of acceleration plotted against time. This graph plots time along x-axis (horizontal) and acceleration on the y axis (vertical).
Slope of the acceleration time graph
Before studying about the slope of an at graph let’s first understand the concept of slope according to mathematics. You can skip this section if you are already aware of this concept.
Slope of a line
Meaning of slope
Mathematically slope of any line is defined as the ratio of the vertical change (rise) to the horizontal change (run) between any two points on the line. It represents the steepness or gradient of the line. The slope is usually denoted by the letter ‘m’.
Formula for slope
The equation for calculating the slope (m) between two points $(x_1, y_1)$ and $(x_2, y_2)$ on a line is given by:
$m = \frac{y_2 – y_1}{x_2 – x_1}$
The explanation of the equation is as follows:
- $y_2 – y_1$: This represents the vertical change, or the difference in the y-coordinates of the two points.
- $x_2 – x_1$: This represents the horizontal change, or the difference in the x-coordinates of the two points.
A positive slope indicates that the line rises from left to right, while a negative slope indicates that it falls from left to right. A slope of zero indicates a horizontal line.
What does the slope represent on an acceleration graph?
The slope of an a-t graph represents the jerk, which is the rate at which acceleration changes with respect to time.
Let us understand this with the help of graph given below.
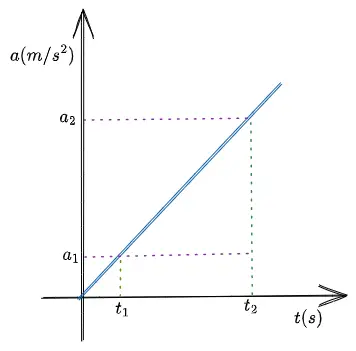
The slope (jerk) of above a-t graph is given by equation,
$$Slope=Jerk=\frac{a_2-a_1}{t_2-t_1}=\frac{\Delta a}{\Delta t}$$
Now this is for the case of uniformly accelerated motion.
In case of non-uniform accelerated motion, for an acceleration-time (a-t) graph, the slope represents the rate at which acceleration changes with respect to time. This rate is called “jerk”.
To determine the slope of the a-t graph for a motion with variable acceleration, differentiate the acceleration equation with respect to time.
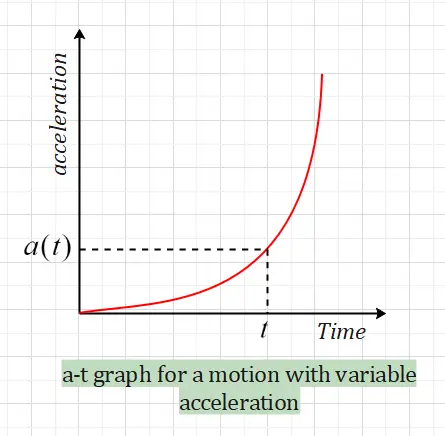
Suppose the acceleration equation is given by $a(t)$, where $a$ represents acceleration and $t$ denotes time. Then, the equation for the slope (jerk) would be:
$J(t) = \frac{da(t)}{dt}$
Here, $J(t)$ is the jerk as a function of time, and $\frac{da(t)}{dt}$ is the derivative of acceleration concerning time. This equation gives you the slope of the a-t graph at any point in time $t$.
Now that you know that jerk is the term used for the slope of acceleration time graph. Let’s learn few more things about this concept.
The concept of Jerk
- In physics, jerk is a measure of how rapidly an object’s acceleration is changing with respect to time.
- It is the third derivative of displacement with respect to time or the first derivative of acceleration with respect to time.
- Conceptually, jerk represents the rate at which the forces acting on an object change or how abruptly the object’s motion changes.
Physical Significance of Jerk
- Smoothness of motion:
Jerk is associated with the smoothness or abruptness of an object’s motion. High jerk means there is sudden abruptness in the motion of the object.. This could lead to rough motion. Low jerk indicates smoother motion changes. - Mechanical stress:
In mechanical systems, a high jerk can cause stress and wear on components, such as gears, motors, and bearings. Minimizing jerk is essential to prolong the life of these components and improve their performance.
Area under acceleration graph
To understand what is area under the acceleration time graph consider the figure given below
From above graph we can see that area under a-t graph would be equal to area of a recrtangle of width $\Delta t = t_2-t_1$ height $\Delta a=a_2-a_1$
Now area under this rectangle is
$area=\Delta a \cdot \Delta t$
we know that acceleration
$\Delta a=\frac{\Delta v}{\Delta t}\,\,\Rightarrow \Delta v=\Delta a \cdot \Delta t$
This shows that,
The area under an acceleration-time (a-t) graph represents the change in velocity of an object over a specific period of time.
Mathematically,
$area=\Delta v$
where $v$ is the velocity of the moving object.
Let us understand this with the help of an example.
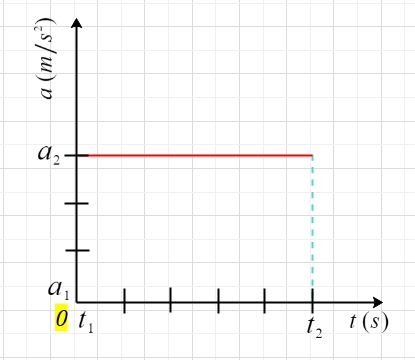
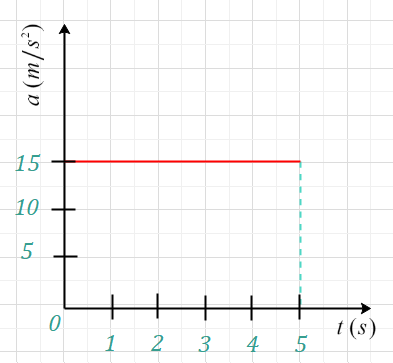
Figure given below shows the simplest case of an object moving with constant acceleration.
From the acceleration vs time graph given below, find the the velocity at t = 5 sec.
We know that,
$\Delta a=\frac{\Delta v}{\Delta t}$
By multiplying both sides of equation by $\Delta t$ we get
$\Delta v=\Delta a \cdot \Delta t$
Substituting the values in the above equation we get
$\Delta v=(15-0)\cdot (5-0)=75 m/s$
Finding the area under the curve is equivalent to multiplying the acceleration by the time interval. The shape of the area under the curve is a rectangle. This area is calculated by multiplying height by width. In this case, the height is $15 m/s^2$ and the width is $5 s$.
$area=15\,m/s^2\times 5\,s=75\,m/s$
By calculating the area under the acceleration-time graph, you can determine the change in velocity (∆v) of the object over the time interval considered.
Here’s what different areas under the acceleration-time graph signify:
- Positive area (above the x-axis):
If the area under the graph is positive, it indicates that the object’s velocity is increasing over the given time interval. - Negative area (below the x-axis):
If the area under the graph is negative, it indicates that the object’s velocity is decreasing (decelerating) over the given time interval. - Zero area (on the x-axis):
If there is no area under the graph because the acceleration is zero, it means that the object is moving with a constant velocity during the given time interval.
Analyzing a-t graph
The graph can be used to understand how the acceleration of an object changes over a specific period of time. Here are some key points to remember when interpreting an acceleration-time graph:
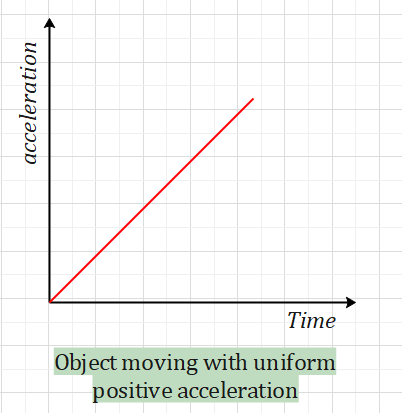
If the graph has a positive slope, the acceleration is increasing over time.
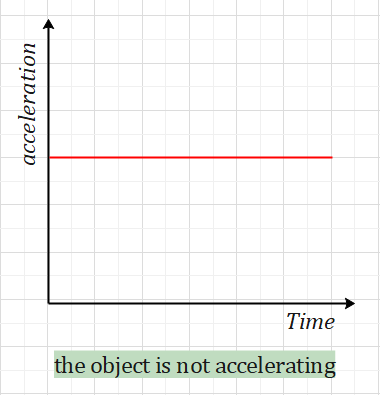
If the graph is a horizontal line on the x-axis, the object is not accelerating (constant velocity).
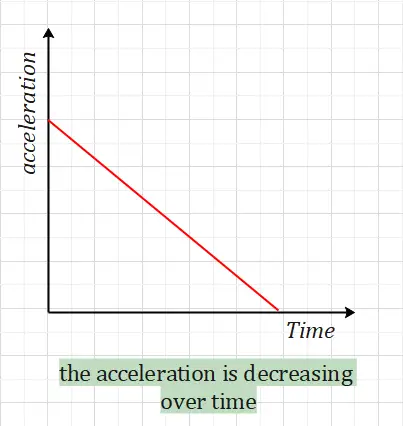
If the graph has a negative slope, the acceleration is decreasing over time.
The area between the graph line and the x-axis represents the change in velocity over time. If the graph is above the x-axis, the velocity is increasing, and if it is below the x-axis, the velocity is decreasing.
Related Terms
Given below are some terms that you must know about in order to understand a-t graphs.
- Acceleration: Acceleration is the rate of change of an object’s velocity over time, and it can be positive, negative, or zero.
- Time: Time is the independent variable in an a-t graph, representing the duration during which the acceleration occurs.
- Velocity: Velocity is a vector quantity that describes an object’s speed in a specific direction, representing the rate of change of its position over time.
- Area under the graph: The area under an a-t graph signifies the change in velocity of an object over the given time interval.
- Jerk: Jerk is the rate of change of acceleration with respect to time, and it’s indicated by the slope of the a-t graph.