Average velocity is defined as the displacement divided by the time during with the change in position of the particle takes place. Average velocity is a vector quantity and its SI unit is meter per second \((m/s)\). So,
\[v_{avg}=\frac{\Delta \vec{x}}{\Delta t}=\frac{x_2-x_1}{t_2 -t_1}\]
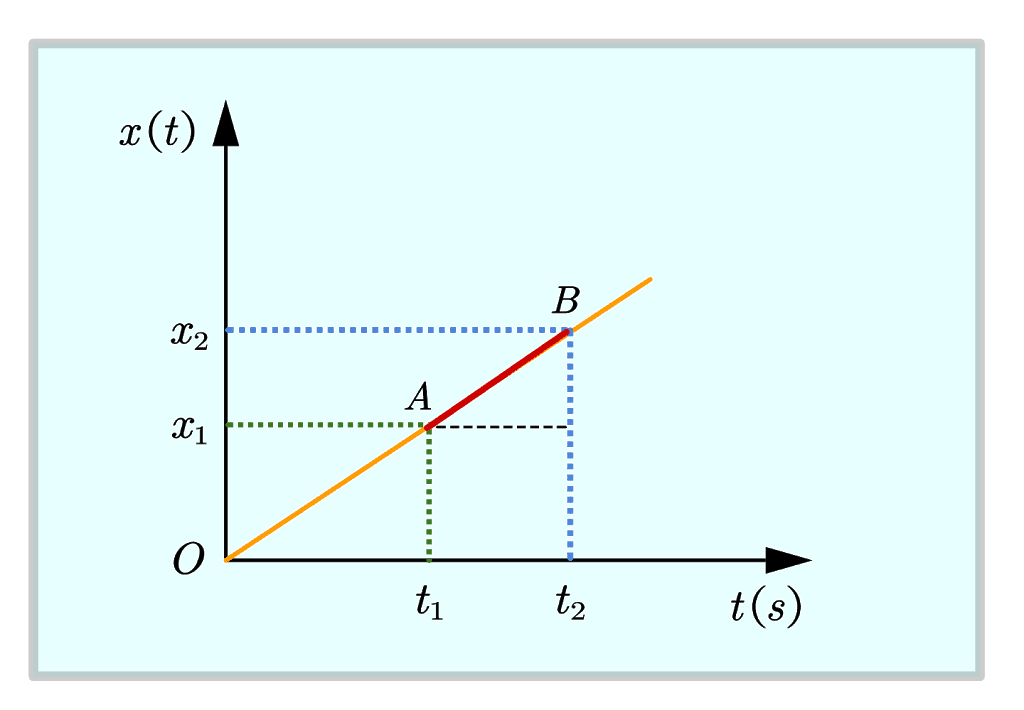
Consider the figure given below
On a position vs time graph, the average velocity is the slope of the secant line joining the position at the beginning and end of \(\Delta t\). That is we have to find the value of \(x_1\) at time \(t_1\) and \(x_2\) at time \(t_2\). Here in case of the above figure secant line is line \(AB\) in red color.
NOTE:- Please note that in position vs time graph we plot independent quantity on the x-axis and dependent quantity on the y-axis. Here time is our independent quantity and position of the particle which is changing with the passage of time is our dependent quantity.
To find velocity on the position-time graph you can follow the following steps:-
- Find the positions on the graph that represent the initial position and final position.
- Draw secant line joining these points.
- Calculate the slope of the secant \[Slope(m)=\frac{\Delta y}{\Delta x}=\frac{y_2-y_1}{x_2-x_1}\]
The most important thing when you write your answers do not forget to mention the unit and the sign (whether the quantity is positive or negative). If the quantity you are calculating is a vector quantity then also check and mention the direction.
Average velocity for linear graph
Let us again consider Figure 1 which is a linear position-time graph. Now we will find the average velocity of the particle during time interval \(t_1\) and \(t_2\). For finding the average velocity of particle we have to find the slope of secant \(AB\) in this case.
The slope of secant line \(AB\) would be,
\[v_{avg}=\text{slope of AB}=\frac{x_2-x_1}{t_2 -t_1}\]
Average velocity for a curved graph
Consider the figure given below which shows a curved position-time graph. We will now look at how to find average velocity on a position-time graph which is curved and not linear.
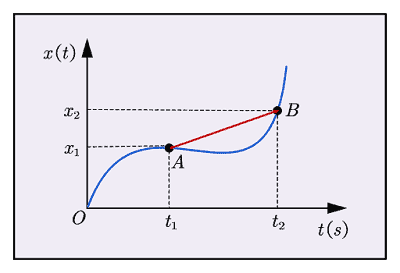
In this case, if we want to find the average velocity of the particle during the time interval \(t_1\) and \(t_2\) then we would have to find points on the graph that represent initial and final position. Our initial position is at time \(t_1\) and the final position is at time \(t_2\).
Their positions are at point \(A\) and \(B\) respectively. Let \(x_1\) and \(x_2\) be the initial and final positions of the particle. So initially our particle is at point \(A\) at time \(t_1\) and at point \(B\) at time \(t_2\) . The line \(AB\) (red line) is the secant and the slope of this secant represent the average velocity of the particle during time interval \(t_1\) and \(t_2\).
So, our average velocity would be \[v_{avg}=\text{slope of AB}=\frac{x_2-x_1}{t_2 -t_1}\]
Key Takeaway:- The slope of the straight line joining two points on the position-time graph gives the average velocity of the particle between these two points.
Related Article