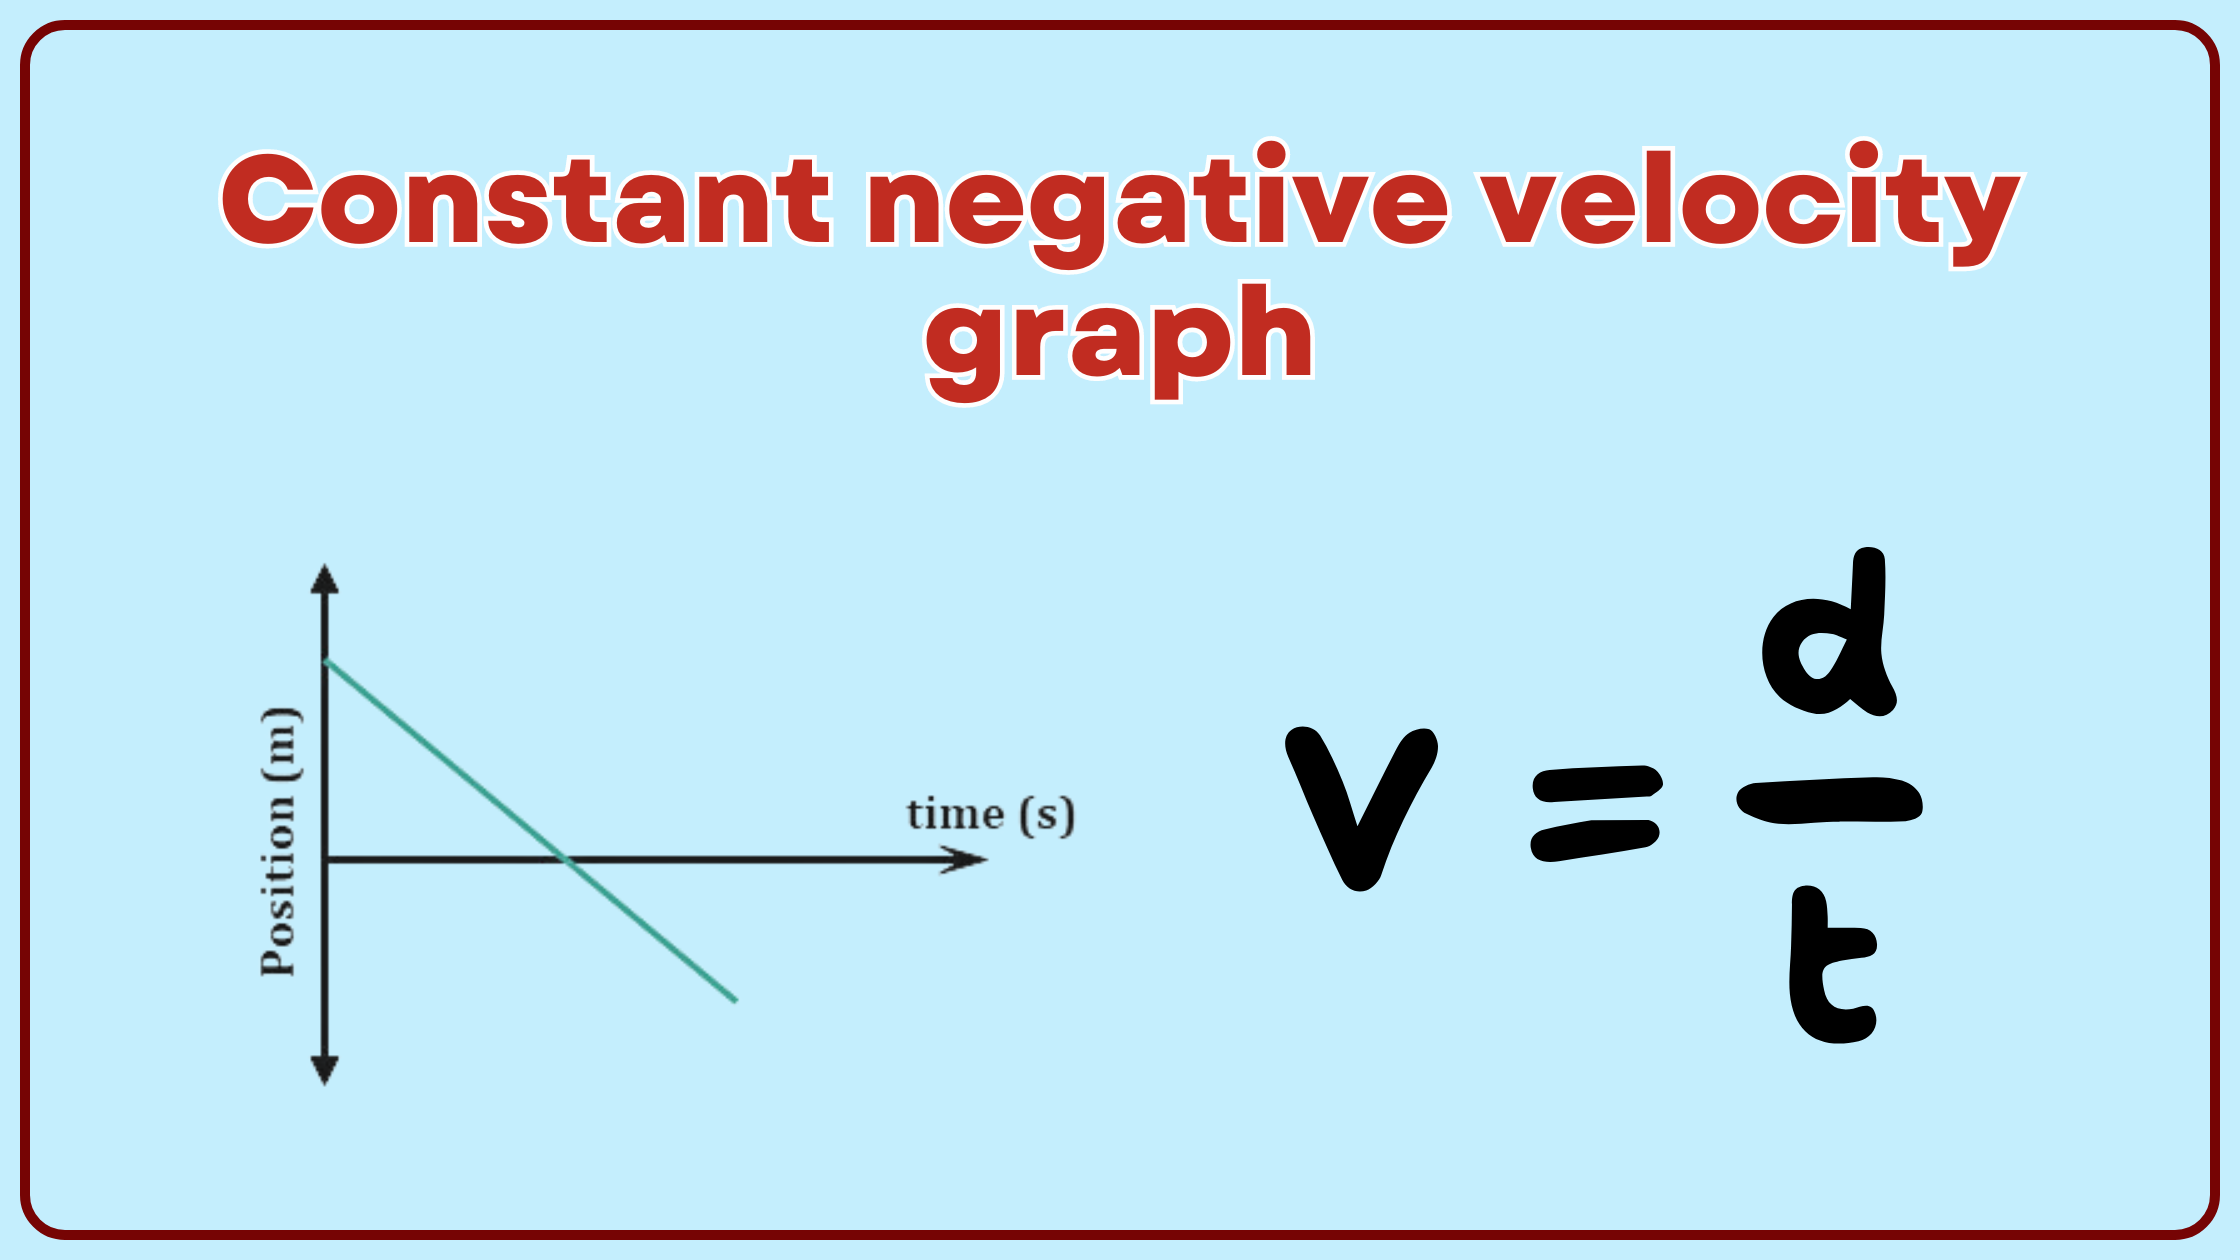
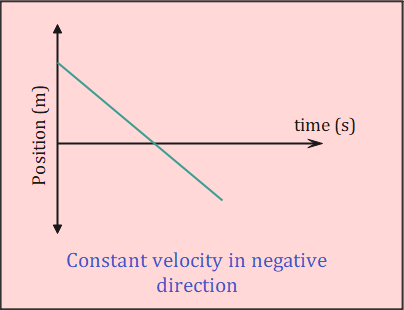
A constant negative velocity graph is a straight line with a negative slope on a position-time graph, representing an object moving at a constant speed in the opposite direction of the positive axis.
Explanation
In physics, velocity is a vector quantity that describes both the speed and direction of an object’s motion. When we talk about a constant negative velocity, we’re referring to an object moving at a steady speed in a direction opposite to what we’ve defined as positive.
On a position-time graph, this motion appears as a straight line sloping downward from left to right. The steepness of this line indicates the magnitude of the velocity – a steeper line means a faster speed.
Key Features of a Constant Negative Velocity Graph:
- Straight Line: The graph is always a straight line, indicating that the velocity doesn’t change over time.
- Negative Slope: The line slopes downward from left to right, showing that the position is decreasing over time.
- Constant Slope: The slope of the line remains the same throughout, representing a constant velocity.
Mathematical Representation
The equation for a straight line on a position-time graph is:
$$ x = x_0 + vt $$
Where:
- $x$ is the position at time $t$
- $x_0$ is the initial position
- $v$ is the velocity
- $t$ is the time
For a constant negative velocity, $v$ would be a negative value.
The slope of this line represents the velocity:
$$ v = \frac{\Delta x}{\Delta t} = \frac{x_2 – x_1}{t_2 – t_1} $$
For a constant negative velocity, this slope will be negative and constant throughout the motion.
Real-World Examples
Constant negative velocity can be observed in various scenarios:
- A car reversing at a steady speed
- An elevator descending at a constant rate
- A submarine diving at a uniform speed
Importance in Physics
Understanding constant negative velocity graphs is crucial for:
- Interpreting motion in one dimension
- Calculating average velocity and displacement
- Comparing different types of motion
- Solving problems involving uniform motion
By analyzing these graphs, students can gain insights into an object’s position, direction of motion, and speed at any given time. This forms a foundation for more complex concepts in kinematics and dynamics.
Remember, the “negative” in constant negative velocity doesn’t imply slowing down – it simply indicates motion in the opposite direction to what we’ve defined as positive. The object is still moving at a constant speed, just in the reverse direction.


