In this article, we will go over the concept of non-uniform motion in depth. We already understand what uniform motion is. If we observe things around us, such as objects falling due to gravity, we will notice that objects do not always move uniformly.
Objects sometimes accelerate or decelerate while moving. This causes non-uniform motion or variable motion. This type of motion can be observed in our daily lives, from accelerating vehicles to decelerating sports balls.
What is Non-Uniform Motion?
- Non-uniform motion is a type of motion where the velocity of the moving object changes with the passage of time.
- This means that the object either accelerates or decelerates, causing variations in its speed or direction.
- In non-uniform motion, the object does not cover equal distances in equal intervals of time, unlike in uniform motion where the speed and direction remain constant throughout.
Definition
Non-uniform motion is a type of motion where an object’s velocity changes over time, resulting in variations in speed or direction.
The Science Behind it
Non-uniform motion occurs when an object’s velocity changes, either due to acceleration or deceleration. This change can be attributed to the net force acting on the object, which alters its speed or direction.
The equation of motion for non-uniform movement is typically expressed as $a=\frac{dv}{dt}$, where, $a$ is the acceleration, and $t$ is the time taken.
Types of Non-Uniform Motion
There are two primary types of non-uniform motion:
a. Accelerated Motion:
An object experiences increased velocity over time, such as a car speeding up.
b. Decelerated Motion:
An object’s velocity decreases over time like a ball slowing down after being thrown.
Here it is important to note that both acceleration and deceleration can be non-uniform or uniform in nature.
Real-Life Examples of Non-Uniform Motion
Non-uniform motion is pervasive in the world around us, with numerous examples:
a. Cars: Accelerating from a stop or braking to a halt.
b. Gravity: Objects falling under the influence of gravity, like skydivers or tossed balls.
c. Sports: Athletes sprinting or slowing down during a race.
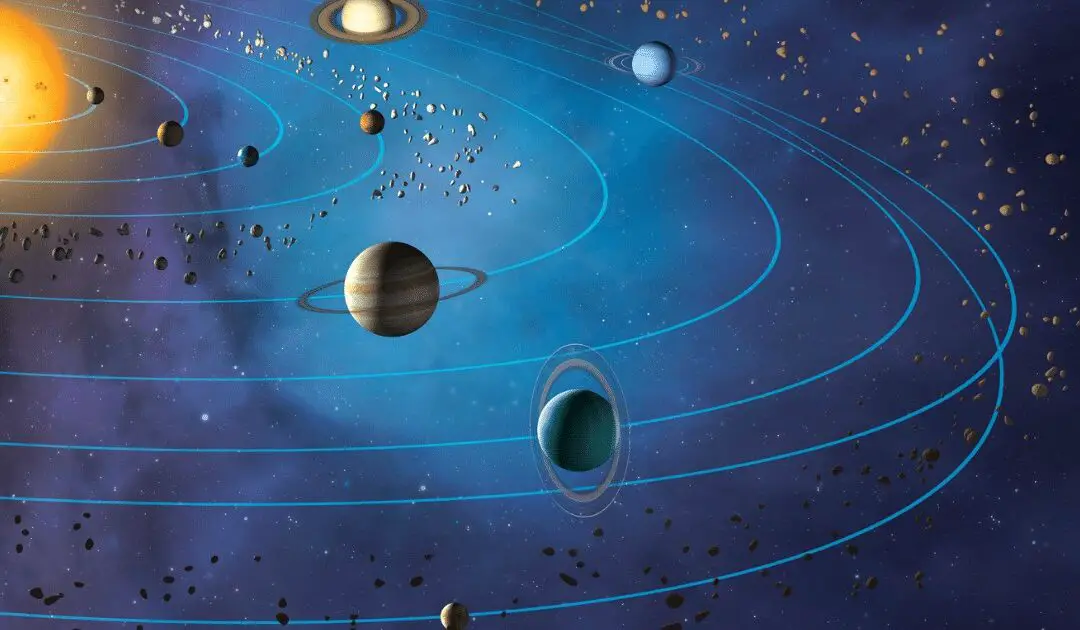
d. Planetary Motion: Planets follow elliptical orbits around the sun, experiencing varying velocities.
Graphical Representation
So we all know that bodies falling from a certain height are an example of variable or non-uniform motion. This kind of motion is uniformly accelerated motion as acceleration due to gravity remains constant near the surface of the Earth.
For a freely falling object under the influence of gravity, displacement is given by the equation
Displacement equation:
$$s = ut + (1/2)gt^2$$where:
$s=$ displacement from the initial position $(m)$
$u =$ initial velocity $(m/s) $
$t =$ time elapsed $(s)$
$a =$ acceleration due to gravity ($m/s^2$, approximately $9.81 m/s^2$ directed towards the center of the Earth)
Let us now consider the example of a heavy ball falling under the action of gravity having initial velocity $v=0m/s$ at an initial time $t=0s$
To calculate the distance (s) covered by a falling object with an initial velocity (u) of 0 m/s at different time intervals from $t=0$ s to $t=10 s$, we can use the displacement equation:
$s = ut + (1/2)at^2$
Since the initial velocity (u) is 0 m/s, the equation becomes:
$s = (1/2)at^2$
where a is the acceleration due to gravity (approximately $9.81 m/s^2$ on Earth) and t is the time elapsed in seconds.
| Time (s) | Distance (m) |
|---|---|
| 0.0 | 0.000 |
| 0.1 | 0.049 |
| 0.2 | 0.196 |
| 0.3 | 0.441 |
| 0.4 | 0.784 |
| 0.5 | 1.225 |
| 0.6 | 1.764 |
| 0.7 | 2.401 |
| 0.8 | 3.136 |
| 0.9 | 3.969 |
| 1.0 | 4.905 |
The distances are calculated using the equation $s = (1/2)(9.81)t^2$ and are rounded to three decimal places.
Let us now plot this data on a $x-t$ graph. After plotting this data we get
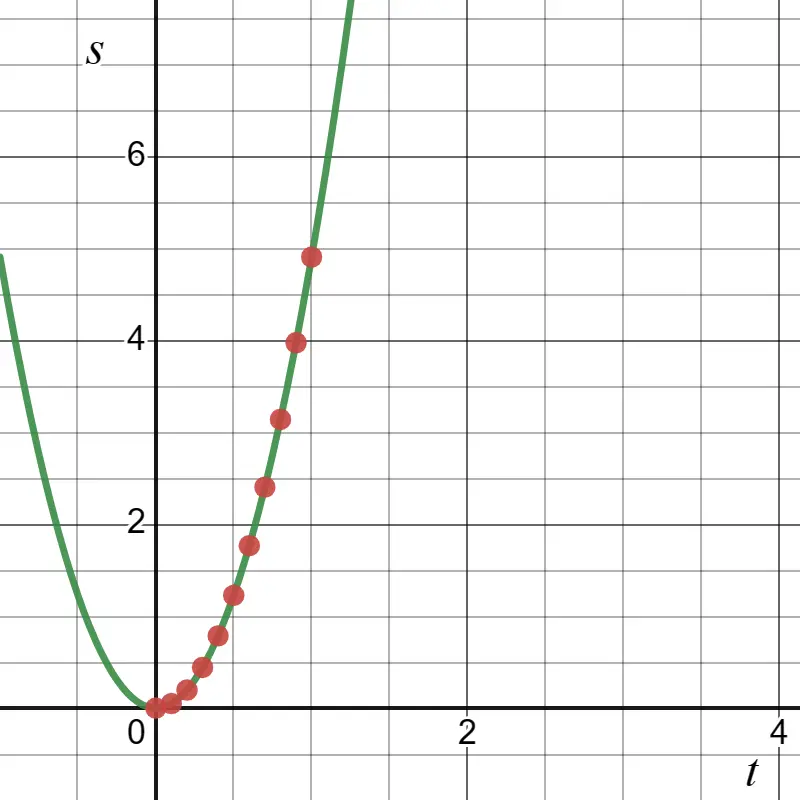
From this graph, we can see that it is not a straight line but a curve that passes through representative points in the coordinate axis.
You can do similar calculations for a ball thrown upwards and plot the graph. Although for this case also motion is along a straight line (Rectilinear Motion) the graph would be different from the one we obtained above in case of the object falling down.
This is because although both objects travel along paths of the same shape, a straight line, their graphs differ because their motions are not of the same nature


